Activities of Traces
To depict each activity of each trace, a scatter plot is created, presenting each trace in the y-axis and each activity on x-axis, colored by activity. Patterns of activities in traces can be revealed.
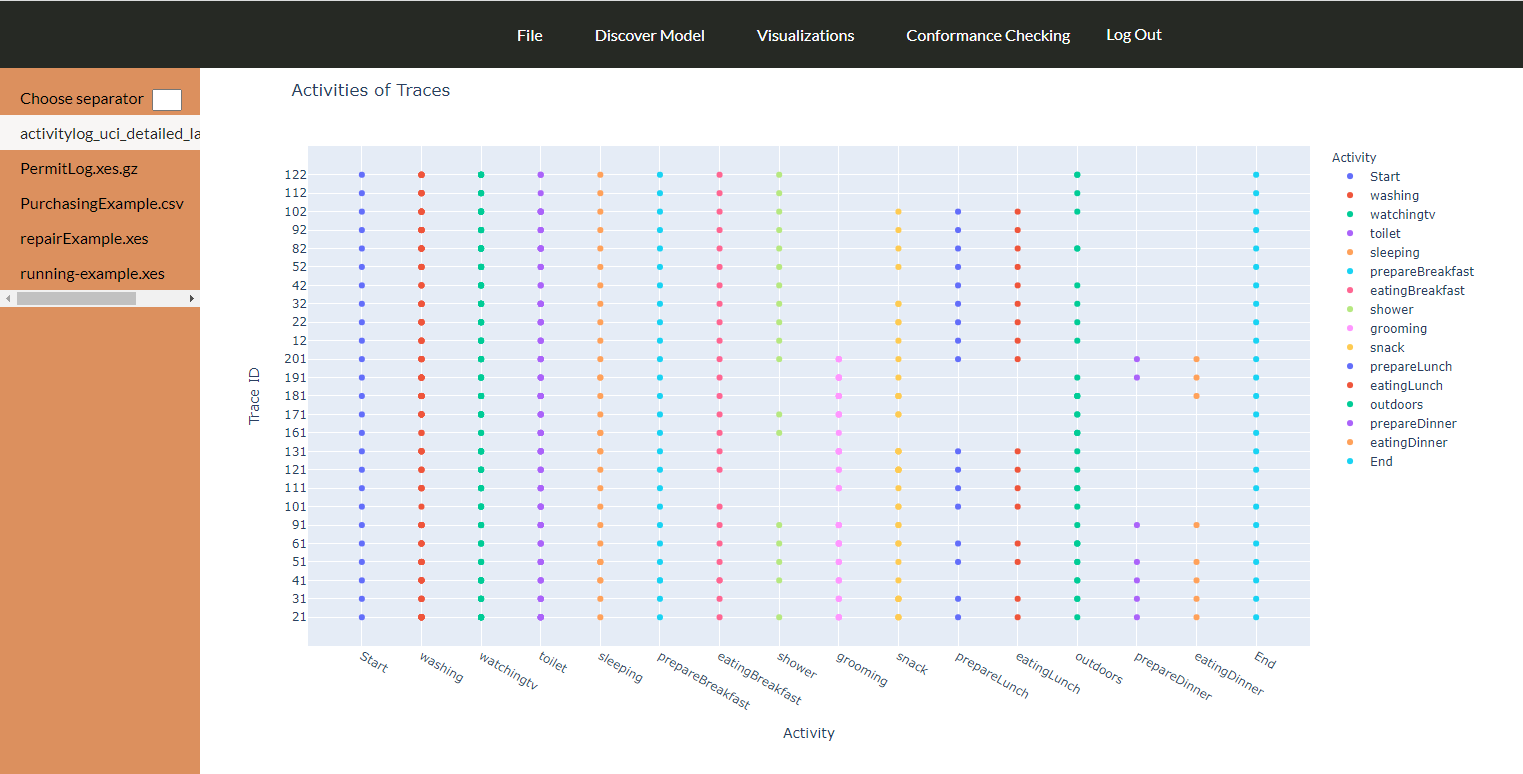
To depict each activity of each trace, a scatter plot is created, presenting each trace in the y-axis and each activity on x-axis, colored by activity. Patterns of activities in traces can be revealed.
![]()
Introduction:
Software:
API: