Traces Duration over time
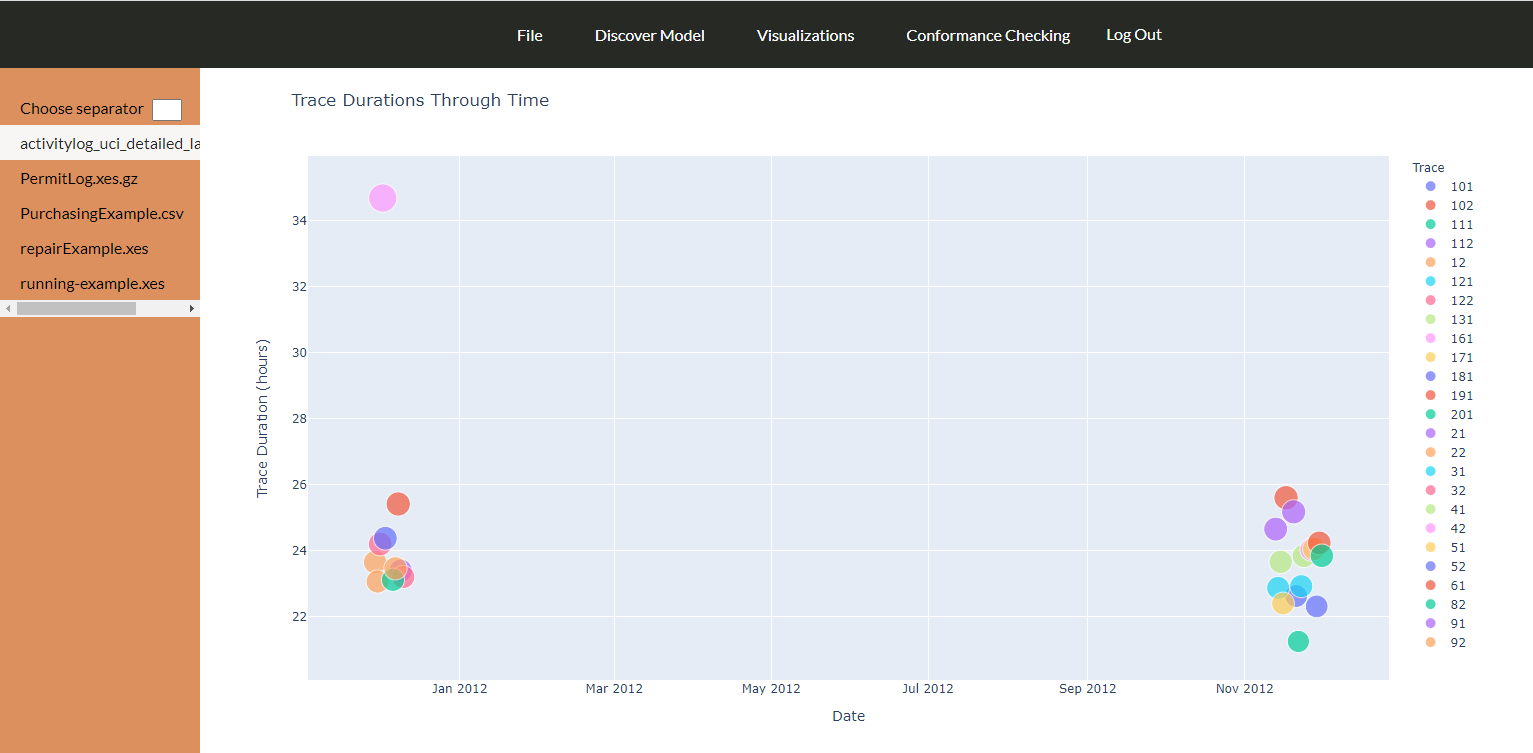
Each trace has a duration, as it happens through time. Showing the duration of each trace is valuable information to explore the dispersion in trace durations and detect anomalies in process (long lasting traces should thoroughly examined for problematic behaviour).
Selecting Traces Duration over time from menu Visualizations a bubble plot is created with the duration of each trace throughout time. The size of the buuble corresponds to the trace duration.