Activities Frequency & Mean Duration
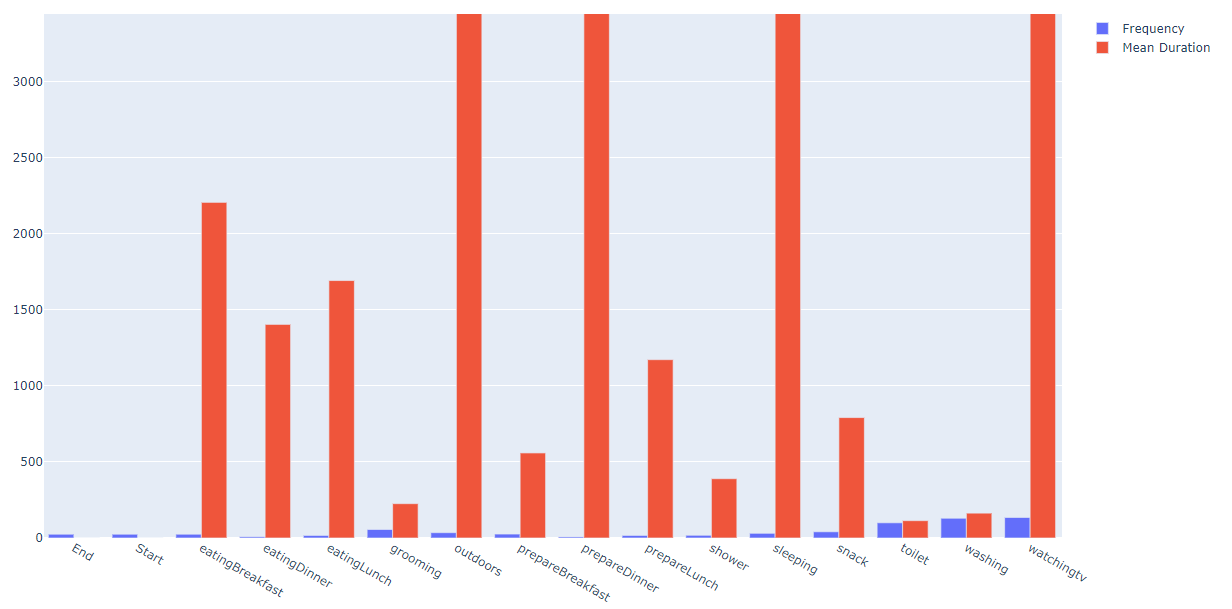
Many times a frequnt activity may have small duration and vice versa. It is very usefull to know if a frequent activity lasts long time, so as to uncover bottlenecks. The following plot depicts the frequency and mean duration of each activity in the same figure so as to be compareable.
Selecting Activities Frequency & Mean Duration from menu Visualizations a bar plot is created with frequency and mean durations of each activity.
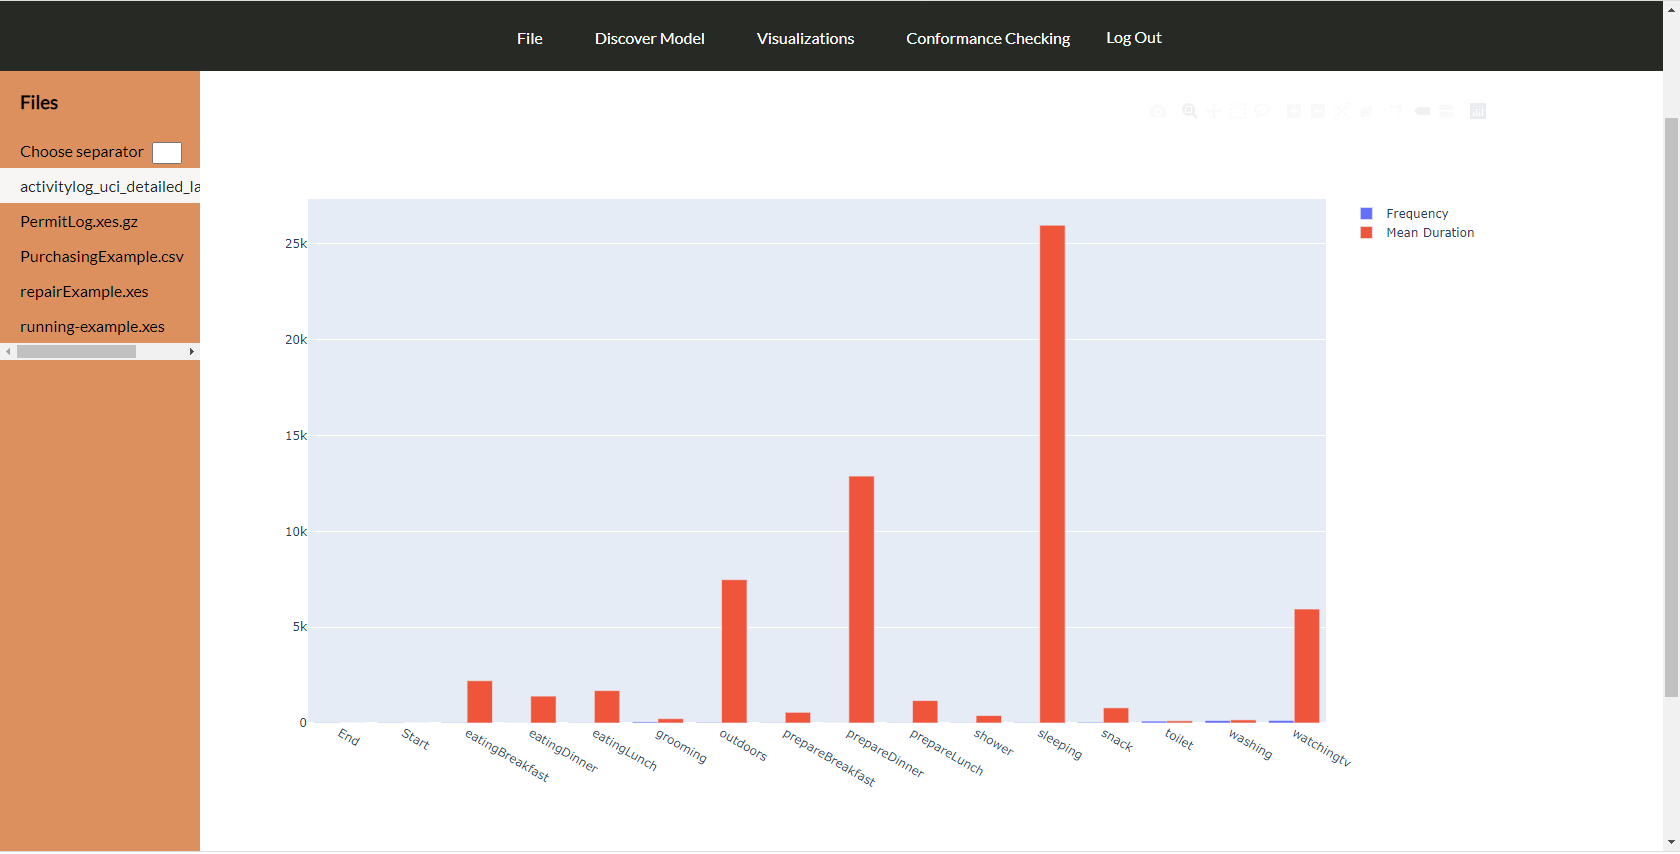
In the case of the event log used, the user can zoom in the graph in order to see the frequency bars more clearly. By hovering each bar the values of frequency or mean duration can be seen.