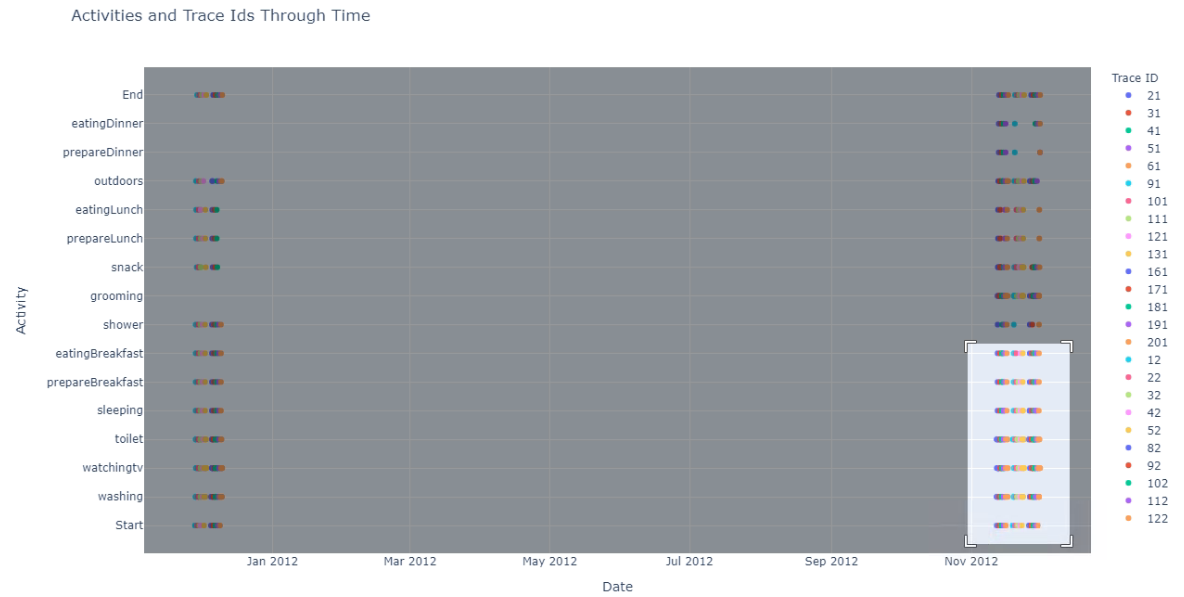
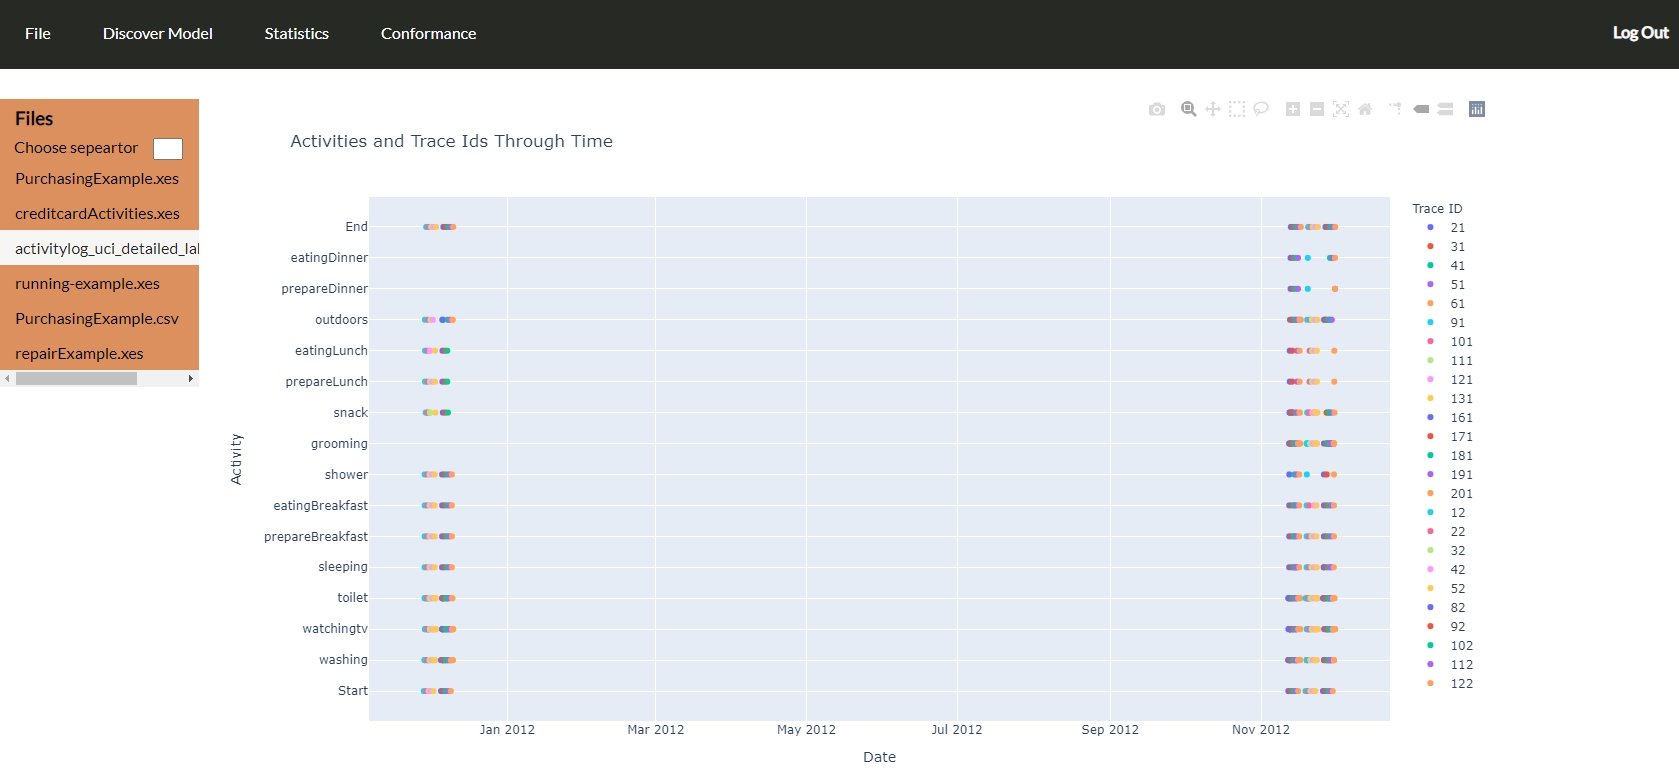
Activities over time
To depict each activity that happened throughout time, a scatter plot is created, colored by trace id.
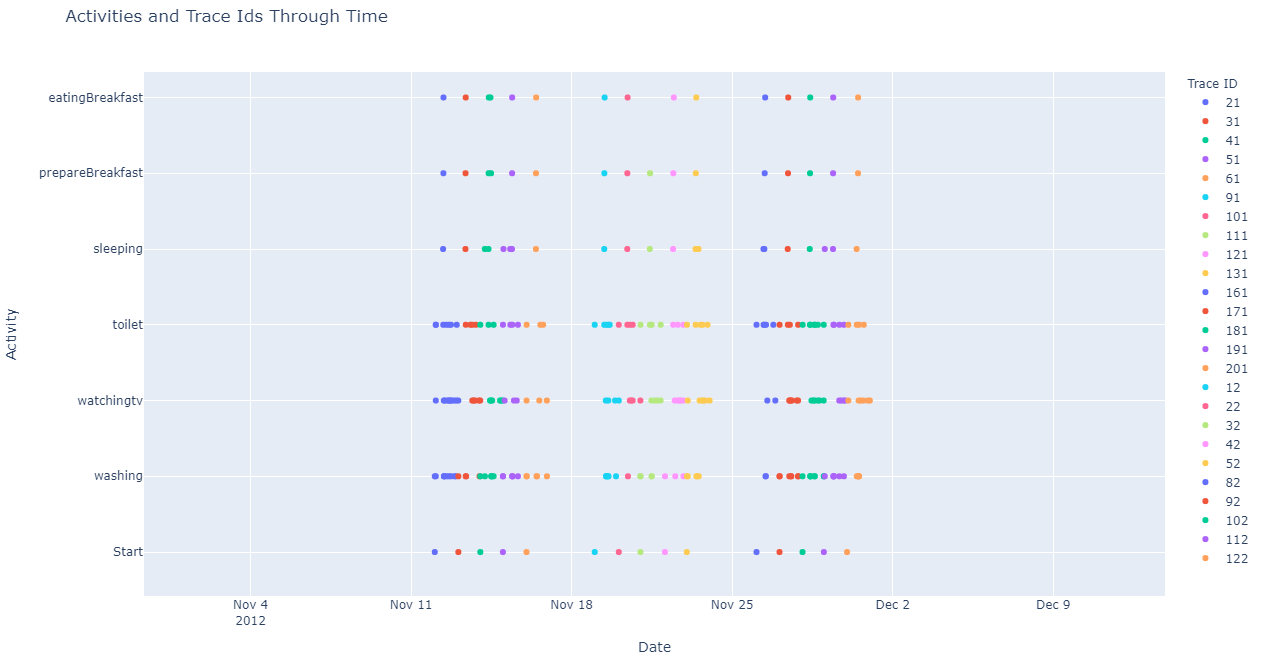
By selecting a region, “zoom in” allows to see a period of time in more detail. Double click restores the initial zoom level.